January 28, 2021
Critical Metrics for Measuring Software Development Team Performance
Measuring your software development team’s performance is important to gain insights on where improvements can be made.
Unfortunately, figuring out which developer performance metrics matter most is no easy task.
These days, you can measure almost anything, making it all too easy to get caught up in a bunch of vanity metrics that don’t tell you anything meaningful about how your business is doing unless those metrics are connected to your business objectives.
Good KPIs answer questions or test hypotheses such as, “how will X impact the customer experience?” Meaningful hypotheses can give you feedback on how your organization is performing in the real world and offer actionable insights you can use to improve.
In these next few sections, we’ll look at some common software development metrics that answer specific questions about your product, performance, and process to help teams drive meaningful improvements.
How to Measure Performance of Software Developers
As mentioned, KPIs for software development projects should answer business questions that support a specific goal—driving revenue, increasing customer satisfaction, getting to market faster, etc.
However, it’s not uncommon for managers to focus on developer performance metrics that seem like they’re measuring something valuable yet fail to provide any actionable insights that can help teams deliver a better product to the end consumer.
An example of this is measuring productivity with input metrics like “hours worked” or “lines of code written in X amount of time” without measuring business impact. In the end, it doesn’t matter how many hours someone works if no one buys the product.
The best software development metrics for measuring your team’s productivity are the ones that measure results. The best metrics for measuring efficiency demonstrate how fast your efforts improve business results.
According to 3Pillar’s Director of Software Delivery Angel Almada, “At the team level, everything gets measured over a team’s velocity. At the individual level, we need to evaluate code quality and collaboration as primary metrics. There’s no standard metric that covers all teams for all purposes.”
3Pillar’s Rodolfo Carmona says, “There’s no magic formula when it comes to performance metrics. Each company has its own style, culture, and values. Based on that, companies need to define what ‘high-performance’ looks like to them, and from there, identify those hard numbers that give them a way to quantify value and track developer performance against big-picture goals or objectives.”
Essentially, metrics are extremely subjective and aim to help you identify whether you’re moving in the right direction based on your current goals. That said, we’ve also compiled a list of KPIs for software development projects that might be worth keeping an eye on.
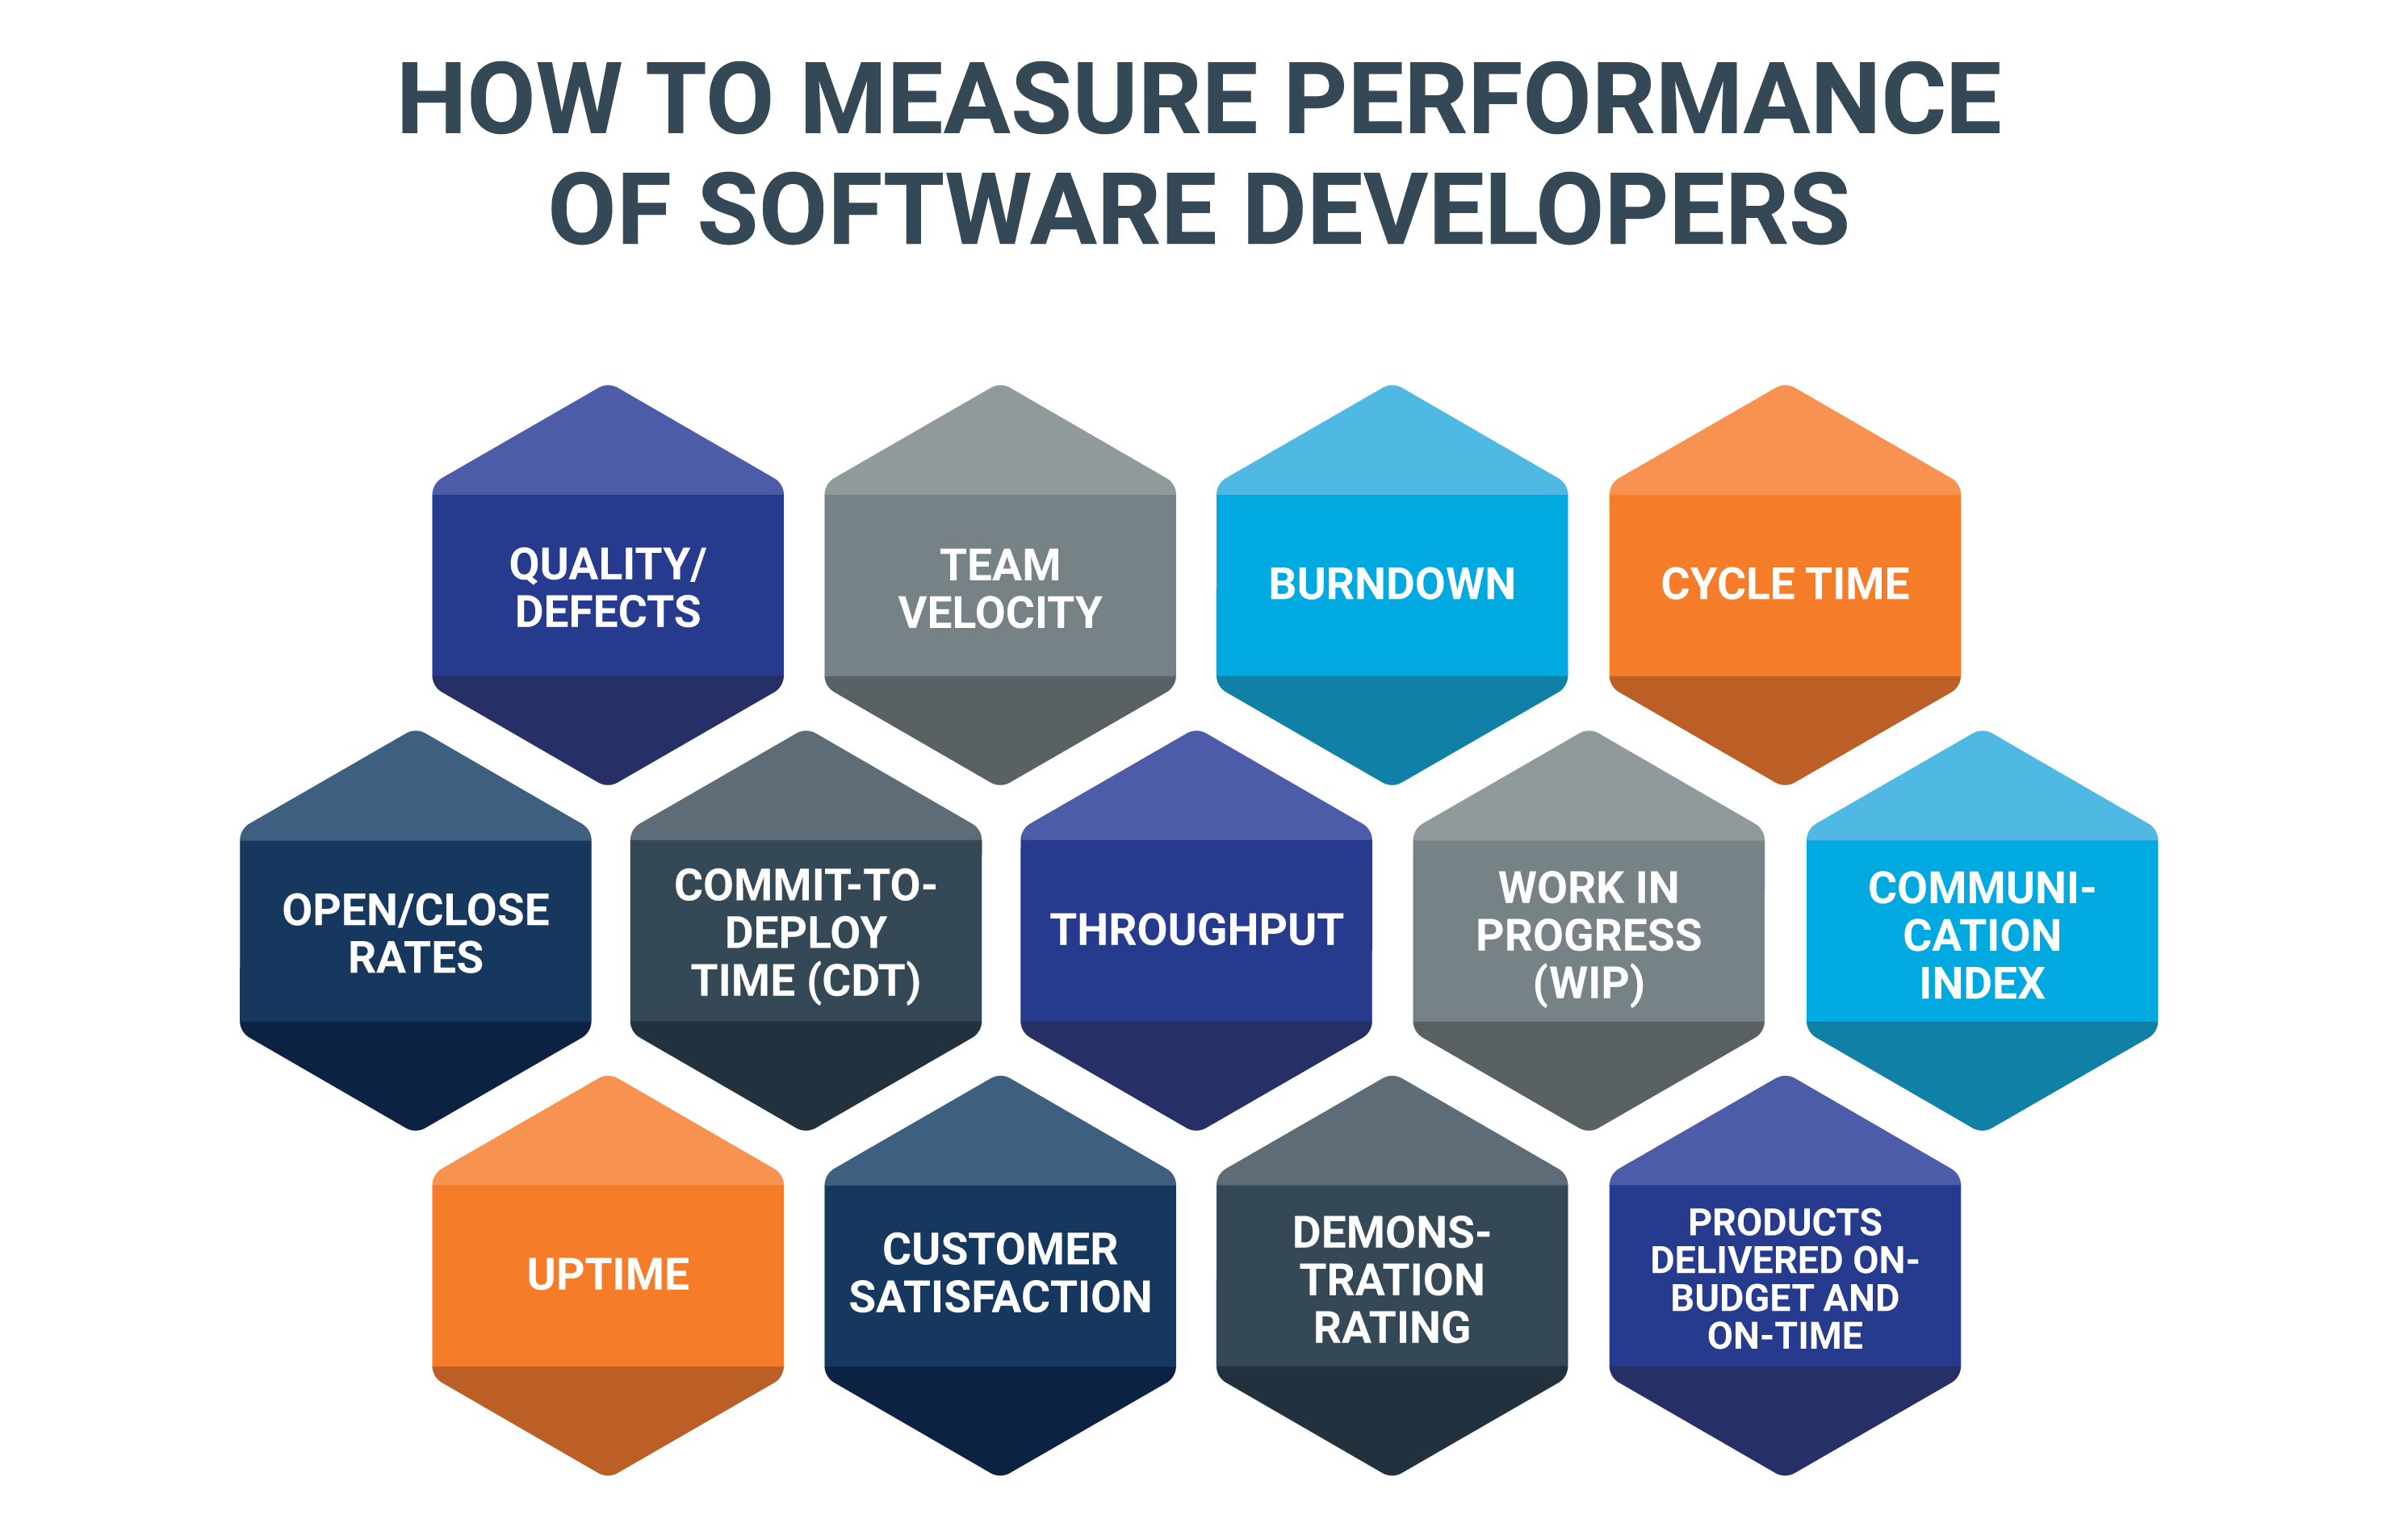
Quality/Defects
In a recent client survey, we asked business leaders which developer performance metrics are most effective for evaluating outsourced software teams–40% of respondents rated “quality/defects” as being most important.
This makes a lot of sense as defective code is one of the more obvious signs that an application fails to meet requirements.
On a related note, you’ll also want to track the amount of time spent identifying, troubleshooting, and fixing quality issues like bugs, usability issues, or an aesthetic that seems “kind of off.”
If your team is spending too much time on fixes—might be a quality issue or a problem with the underlying architecture—it becomes a major drain on productivity.

Team Velocity
Team velocity is an Agile KPI used to measure the amount of work that gets done during a sprint. It is typically measured in terms of hours or story points. Project managers use team velocity to calculate how fast development teams can work through a backlog of tasks.
This system is particularly useful for forecasting, planning future sprints, and identifying whether the team is dealing with any roadblocks.
That said, you’ll want to avoid looking at velocity in a vacuum—it’s an aggregate measure of team output, meaning that it won’t reveal much about individual performance or whether customers were satisfied with the product.
3Pillar’s Aaron R. says, “Velocity and quality are key; however, the ultimate goal is: is it in production? If you can consistently deploy new features and updates that improve the user’s experience, then that is king.”
According to Angel Almada, predictability and reliability can be calculated by looking at velocity on a sprint-by-sprint basis. He says, “Predictability can be measured by looking at the amount of PSIs delivered by the end of a sprint and reliability represented as a ratio—committed vs. delivered.”
Burndown
Burndown represents how fast Agile teams are “burning” through their work.
Sprint burndowns measure how much work was completed during a sprint. This metric is useful for keeping teams aware of any potential blockers they might face during the development process and allows managers to track team progress toward reaching the sprint goal.
Release burndown provides an overview of the release progress. It’s similar to sprint burndown but tracks progress on the project level and allows teams to check whether they’re on track to release the project by a specific date.
Cycle Time
Cycle time measures how much time a team spends working on a specific task. Teams using continuous delivery may measure cycle times in terms of minutes or seconds, as opposed to weeks or months.
Open/Close Rates
Open/close rates measure how many production issues are reported and closed out within a specific time frame. Note that this KPI is better suited for tracking general trends as opposed to getting caught up tracking specific numbers.
Commit-to-Deploy Time (CDT)
This metric measures the time it takes to take the code from the commit stage to the point of deployment—testing, QA, and staging, depending on your organization. CDT tells managers how long it takes to move code through the pipeline and helps ID roadblocks if there are any.
Throughput
Similar to velocity, but more granular, throughput measures features, as well as bugs, tasks, and other activities performed during a given time period. The benefit here is that measuring throughput allows managers to get a better sense of the team’s workload and how they’re spending their time.
Work in progress (WIP)
WIP tracks team’s open tickets/projects. This metric is similar to throughput, though instead of looking back at what developers accomplished during a past sprint, WIP looks at what they’re working on right now.
Communication Index
Communication index measures the communication capabilities between an outsourced team and the internal teams impacted by the project. You can start measuring developer communications by performing a subjective evaluation of communication quality across the following areas:
- Social skills
- English proficiency
- Cultural differences
But don’t stop there—make sure to capture feedback from multiple stakeholders—each of whom should perform an independent assessment before discussing their scores with the team.
The second part of measuring communication is looking at some of the more tangible KPIs closely linked to communication capabilities. For instance, if developers’ English proficiency is lacking, you might look at defect rates and how they’ve changed throughout the course of your partnership.
If the number of defects increased over that period, you might infer that the issue has something to do with language, cultural differences, or developer skills (in which case, you might then look into things like code quality, instances of rework, etc.).
Uptime
If you have a product that’s currently online and live, how often is that product unavailable to customers? Sudden increases in downtime can point toward issues like aging existing infrastructure or an unreliable cloud provider that must be addressed ASAP as they can introduce security risks, friction, and delays.
Customer Satisfaction
Tracking customer satisfaction over time is a clear indicator of whether the team is delivering value back to the end-consumer, and by extension, the bottom line.
For mobile app development, you might keep a close eye on user reviews in the App Store and Play Store. Ideally, the average user rating should either increase over time or remain steady. Otherwise, it means users are unhappy with the app experience.
Let’s say you decide to set a KPI like: Increase 4-5-star reviews by 30% by next quarter.
You might then start collecting data from various feedback channels, including review sites, support tickets, sales interactions, etc., and look for recurring themes/requests.
As you incorporate changes, keep an eye on incoming reviews to learn which updates had the biggest impact on user satisfaction.
Demonstration Rating
Demonstration rating measures the subjective quality rating of a product demo based on feedback from multiple stakeholders.
Demo ratings don’t necessarily reflect the quality of the product itself. Instead, they measure things like presentation, content, and most importantly, how well the development team understands end-user requirements/pain points/priorities.
Products Delivered On-Budget and On-Time
Tracking on-time delivery and ability to stick to a budget allow organizations to set expectations with their customers and deliver what was promised. Internally, these KPIs support strategic planning and forecasting efforts and can help teams identify and fix bottlenecks in the development process before they start causing trouble.
Staying within the projected budget and timeline is also important to clients. Nearly 30% of our client respondents said that delivering projects within budget was one of the top metrics they used to evaluate the performance of outsourced development teams. A total of 35% ranked on-time delivery as the most important software development metric.
Here, you might track “number of hours worked” to find out if developers are billing for excessive overtime or finding out if there’s an opportunity to create more efficient workflows.
Final Thoughts
It’s important to note that managers must also monitor the “intangibles” that can impact performance. Are developers engaging during meetings? Are they speaking up when there’s a problem? Are they just plain burnt out?
If you get the sense that something has changed or that your team is struggling, metrics allow you to check whether your intuition led you down the right path. For example, if your team seems tired or unmotivated, you might look at metrics like “hours worked,” “overtime”, or “features shipped” to find out if developers have too much on their plate.
Ultimately, it’s not the metrics themselves that matter, it’s how those metrics are actually used to make tangible, real-world improvements. As 3Pillar’s Sergio Medina put it, “software development metrics should answer this basic question: ‘are we achieving the goals of the project?’”
No matter which KPIs you use to measure software development performance, ensure you’re working with a team that focuses on delivering measurable results.
Software development is the heart of 3Pillar Global. But there is more. Our focus on the Product Mindset is what sets us apart from others. Contact us today to learn more.